First of all, what are Core Web Vitals?
Core Web Vitals, or CWV are a set of criteria that Google has developed to help website owners and developers improve their sites for their end users.
Many of us lament about Google. For a lot of reasons. Privacy invasions. Changing search algorithms that result in our site moving to page 2. Ending support for useful applications. It’s a pretty long list.
But this is one of those times when they’ve done something right. The CWV are a clear set of criteria that outline some goals for your site to achieve.
There are three core metrics that contribute to the total scoring of a web page, Largest Contentful Paint (LCP), First Input Delay (FID), and Cumulative Layout Shift (CLS).
More acronyms! Don’t worry, we’ll explain shortly. Just a little technical explanation before we get to the good stuff – improving your site!
Largest Contentful Paint

This metric reports the time for the largest element in the viewable area to render. This metric isn’t measuring how long data takes to reach the browser from where it’s delivered like TTFB, it’s measuring how things load for an actual user to be able to interact with the page.
In the age of instant gratification, if your site isn’t loading instantly and ready for your users to make a purchase, download a file or give you a donation, they might leave – and this is a sign to Google that your site isn’t relevant enough to show in search results.
Typically, hefty animations, large full screen images and other bloated code can be the targets of the LCP items on a site that slow things down.
First Input Delay

The FID metric measures the time to when a user can perform an action on your site. FID focuses on when a site can respond to clicks, taps, or key presses.
Some examples of interaction items are:
- Entering an email address
- Clicking a Call-To-Action button
- Opening a menu
- Expanding an FAQ item
- Adding an item to a shopping cart
Any processing of the web page’s information to be displayed until it’s ready to perform action for the user contributes to FID.
Think about the last time tickets went on sale at noon for an exclusive concert. Did the page load fast enough for you to get your order in?
Cumulative Layout Shift

This is one metric that we’ve all encountered. How often have you clicked a link that your friend shared on social media only to be taken to a news site. You know the ones. The ones with ads.
You start to read the article then, oops, and an ad pushes the content out of the way, right when you are ready to click “Read More,” and suddenly you’re on a site for a product you care nothing about.
Or the add to cart button moved as the page loaded more elements and now the wrong item is in your cart.
Annoying, right?
CLS measures how much movement there is in a page from when it starts to load to when it’s finished and usable for the end user.
Page Experience
Google Core Web Vitals are part of a broader set of factors that help rank a page based on overall user experience.
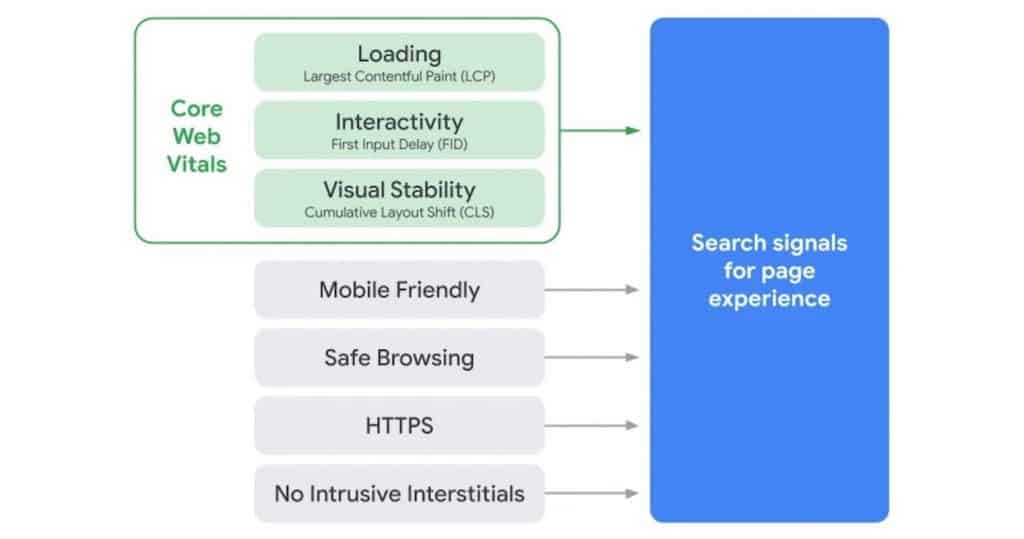
Mobile Friendly
Over 50% of all web traffic is from a mobile device, excluding tablets. This trend is only going to continue as mobile devices and networks get faster worldwide.
Google wants to make sure that your site is accessible on mobile devices as well as the traditional desktop views. You can test your site here to see if it passes the test.
While we don’t always take a “mobile first” approach to design at One Dog Solutions, we design with responsiveness in mind for desktop, mobile and tablet views.
Safe Browsing
This is exactly as it sounds. Your site should be free of malware or malicious code. If you’ve registered your site in Google Search Console, you can check the report in the security tab.

Regular malware scans and having security measures in place help to prevent malicious code ending up on your site will keep you off of Google’s naughty list.
HTTPS
HTTPS connections are a must in today’s world. Having an up to date SSL certificate is a requirement if you want to perform financial transactions like collect donations or sell products.
Let’s Encrypt was a wonderful initiative that is sponsored by many of the world’s technology companies. It’s brought free up to date security certificates to the masses.
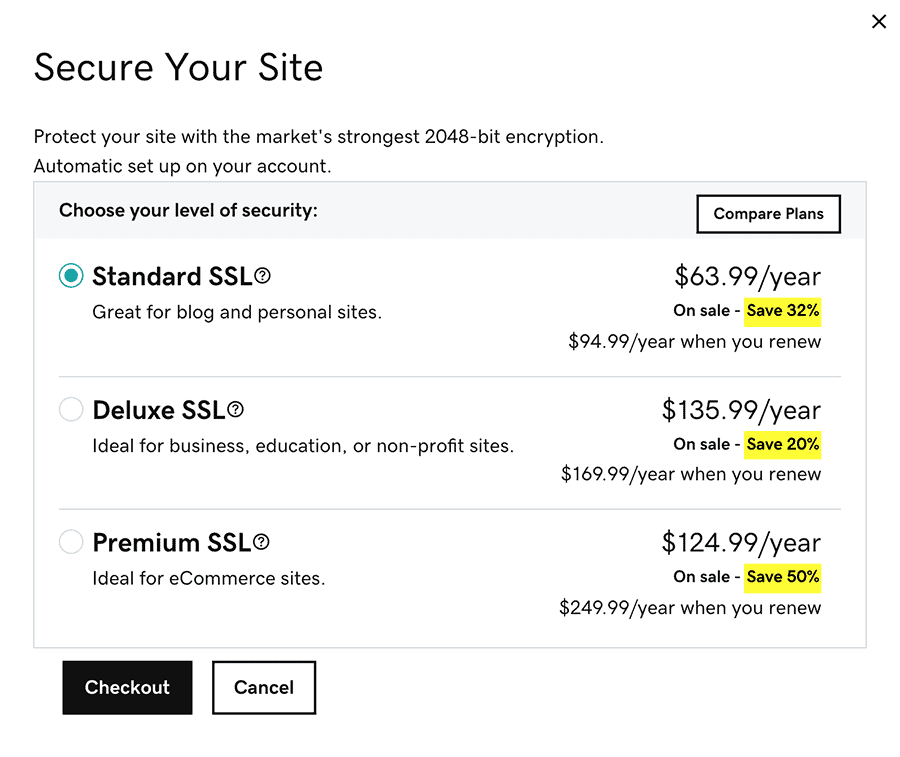
Most hosting companies offer free Let’s Encrypt certificates as part of their services. If they don’t, it’s time to find a new hosting provider.
No intrusive interstitials
You are probably asking what the heck this is, but you’ve most likely already experienced it.

The annoying popups. The ones that happen in a timed manner that cover most or all of the page.
On mobile devices they can render a site useless if the popup can’t be dismissed.
Okay, new acronyms over. Why should I care?
Not only do these new metrics affect your search rankings, but the intent is to help you fix poor user experiences on your site. There was a lot of buzz in the SEO community when these ranking factors were announced last year, and even more grumbling from the development community.
You, as a website owner, should care about these metrics because they help to improve your site for people that want to interact with you, buy your products, or donate to your charity.
Improving the items that contribute to poor CWV scores not only helps your site get found more often in Google search, but it also helps users accomplish tasks on your site faster and more efficiently when they arrive there.
Google uses real user data from their Chrome browser to perform these evaluations, so they aren’t just a bunch of nice numbers to strive for, but actually useful improvements for people who visit your site.
Measuring Website Performance
When it comes to measuring website performance, Google’s tools aren’t the only ones we take into consideration. We typically use a trio of tools that are free to use online and give a more balanced view of how a site actually loads.
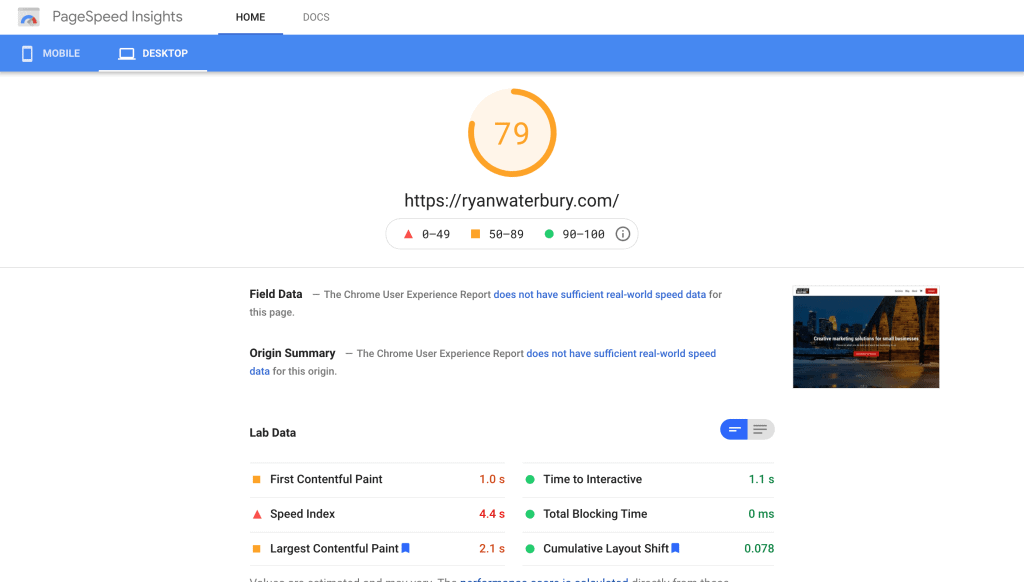
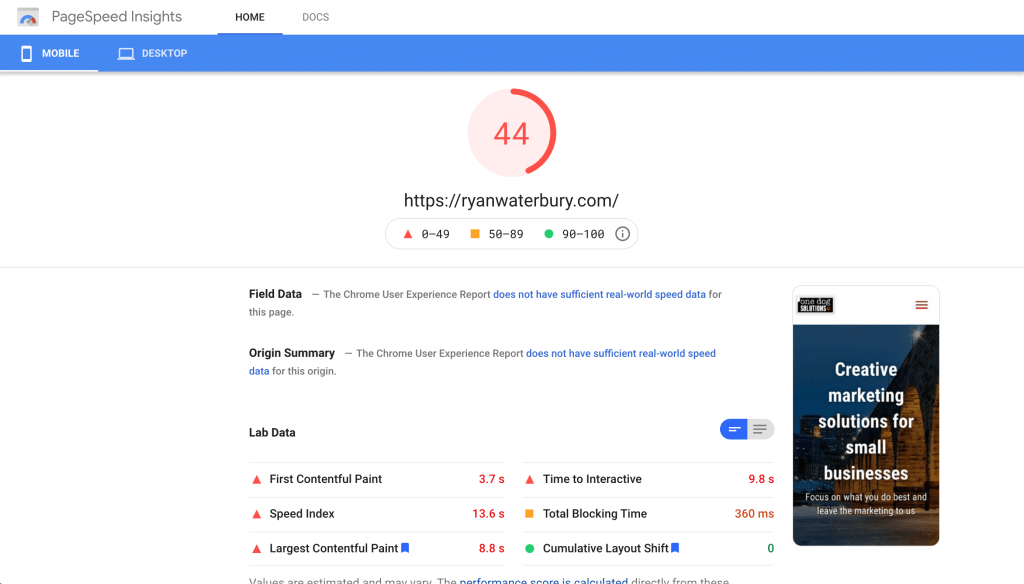
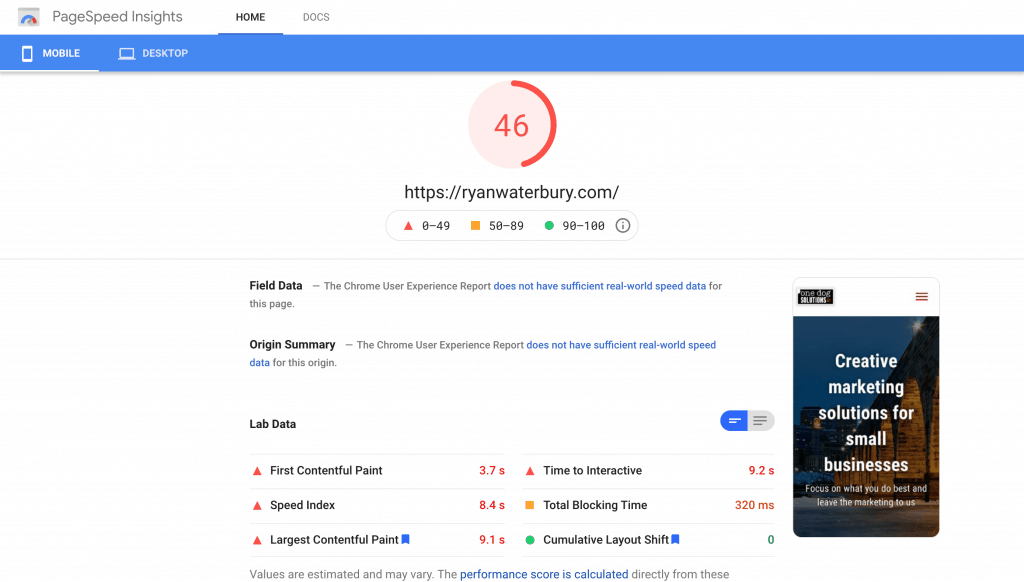
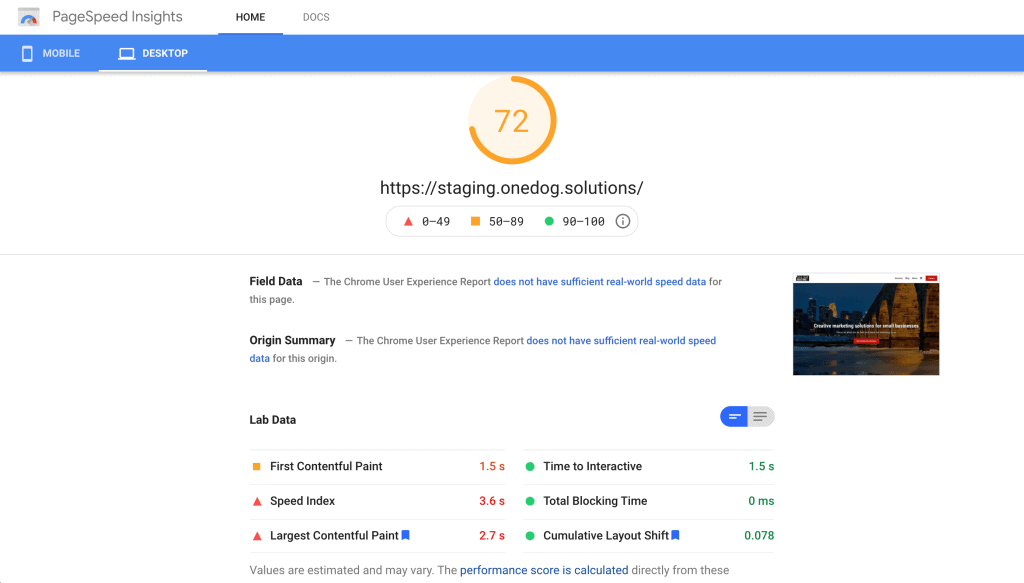
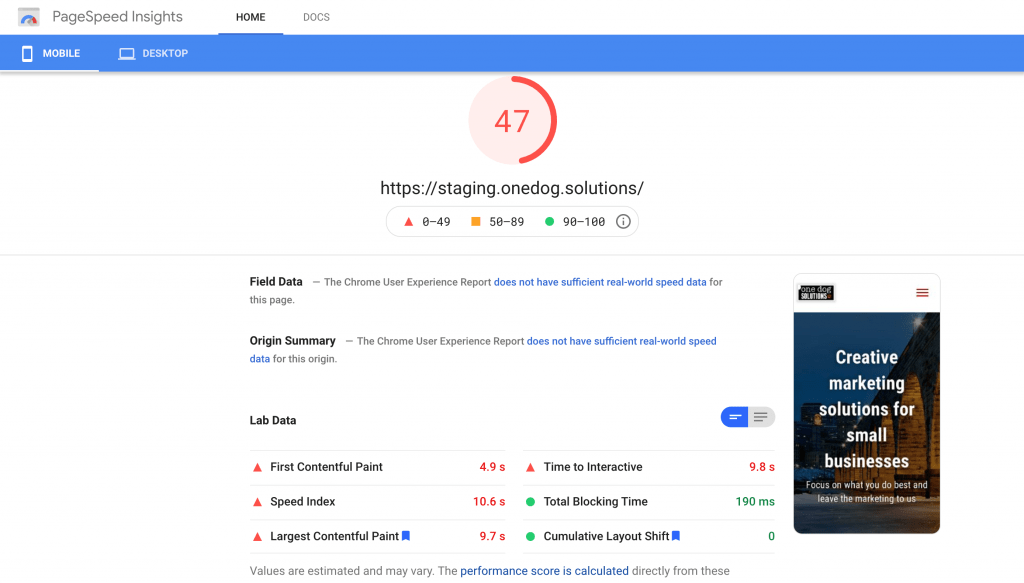
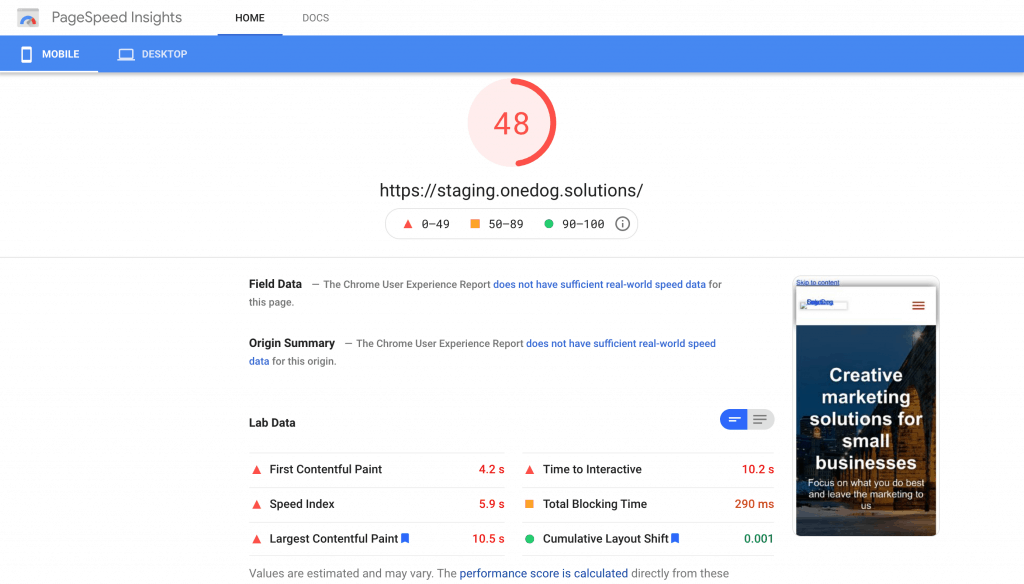
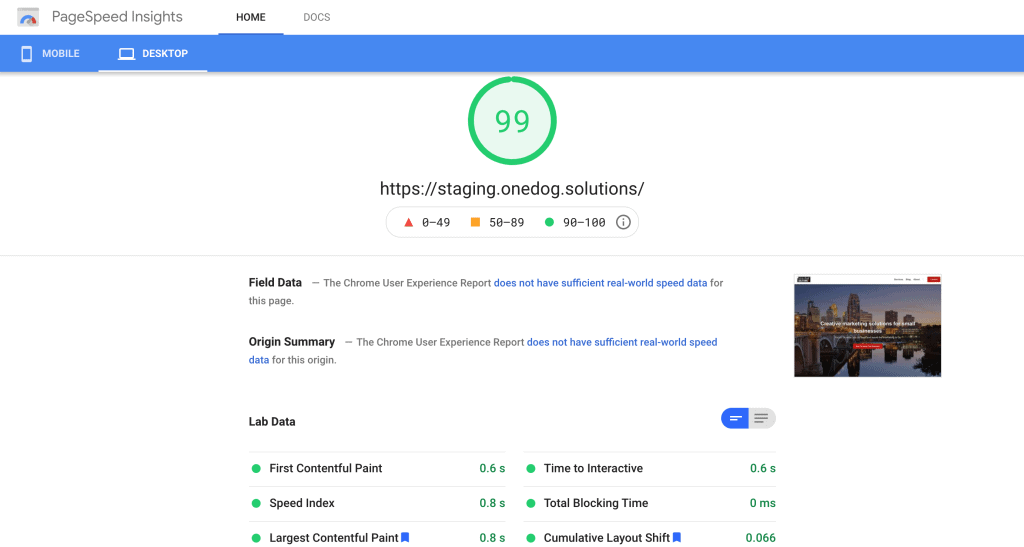
Google PageSpeed Insights
Up until now we’ve talked about scores and indicated some ranges for the Core Web Vital metrics. These metrics are measured and displayed via Google’s Developer Tools PageSpeed Insights. Here you can measure an individual page’s performance.
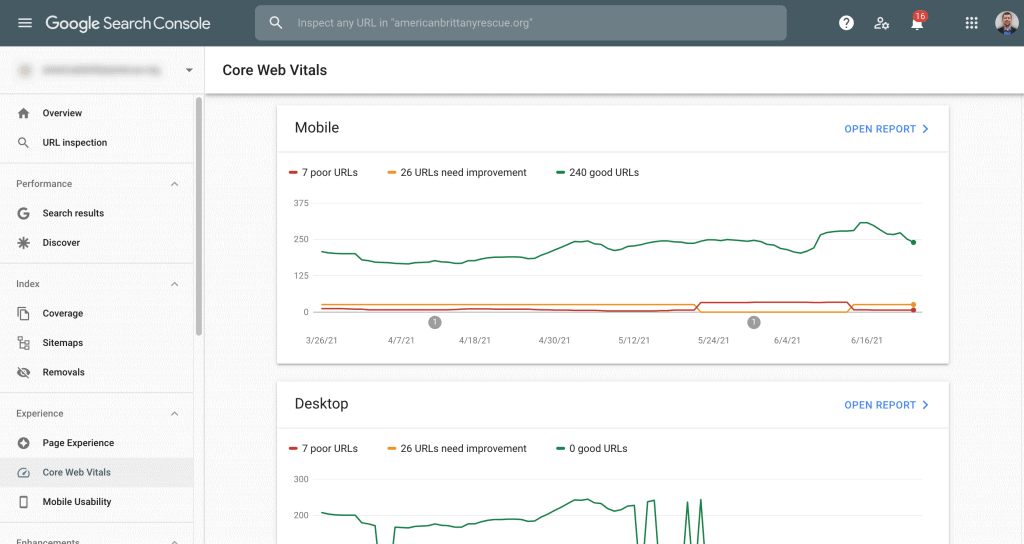
These tests can also be viewed site wide in Google Search Console under the Page Experience section as shown above.
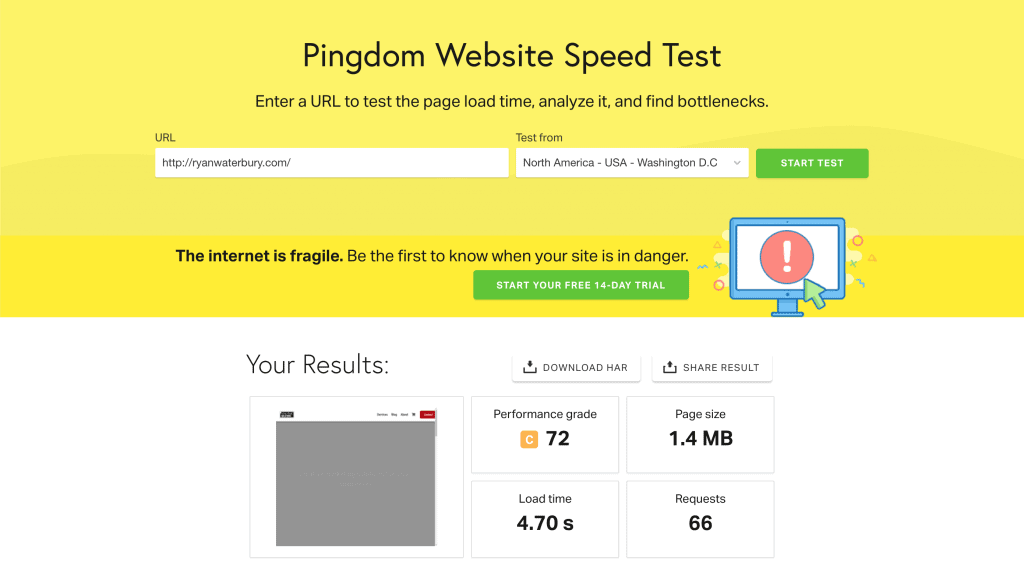
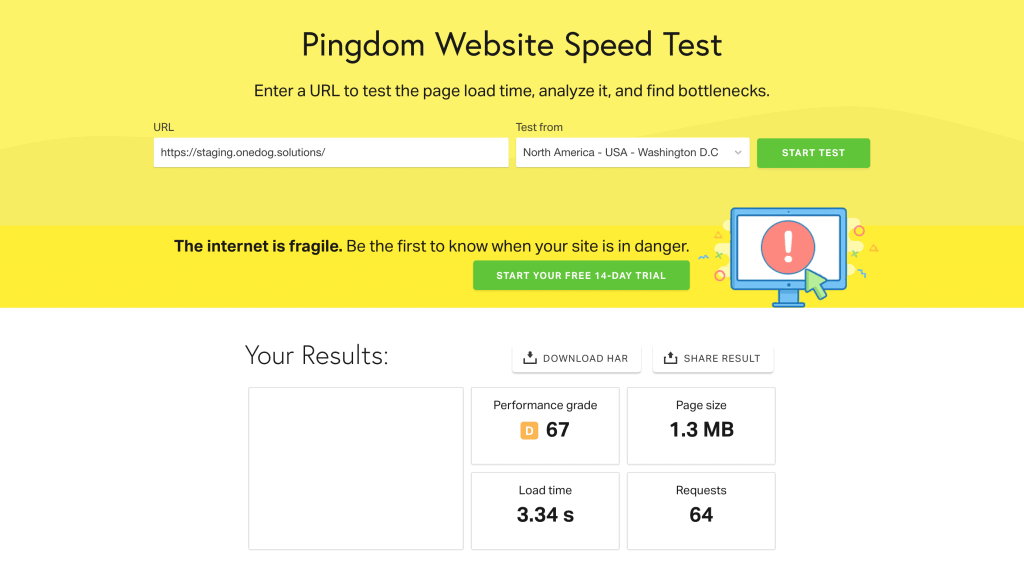
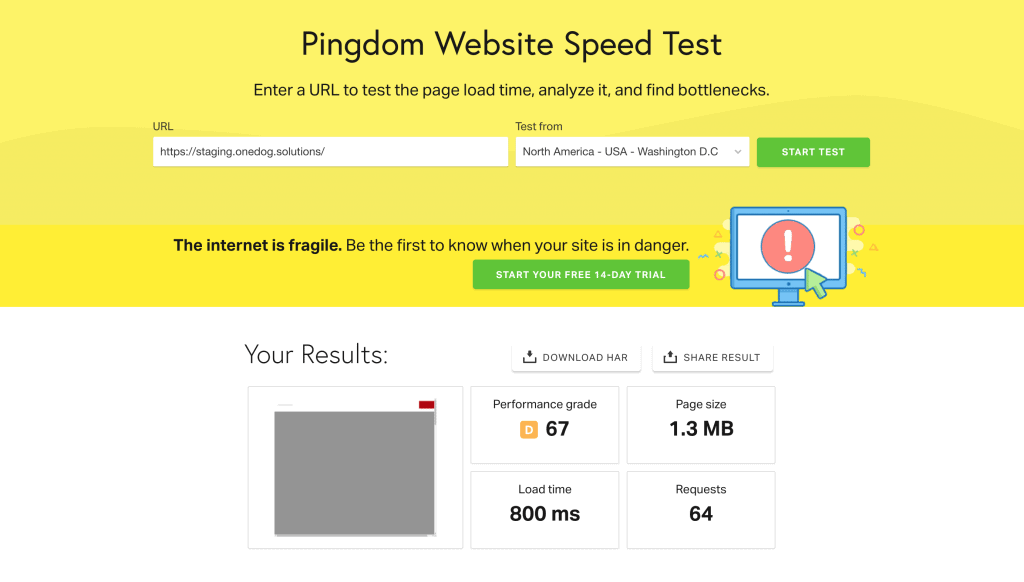
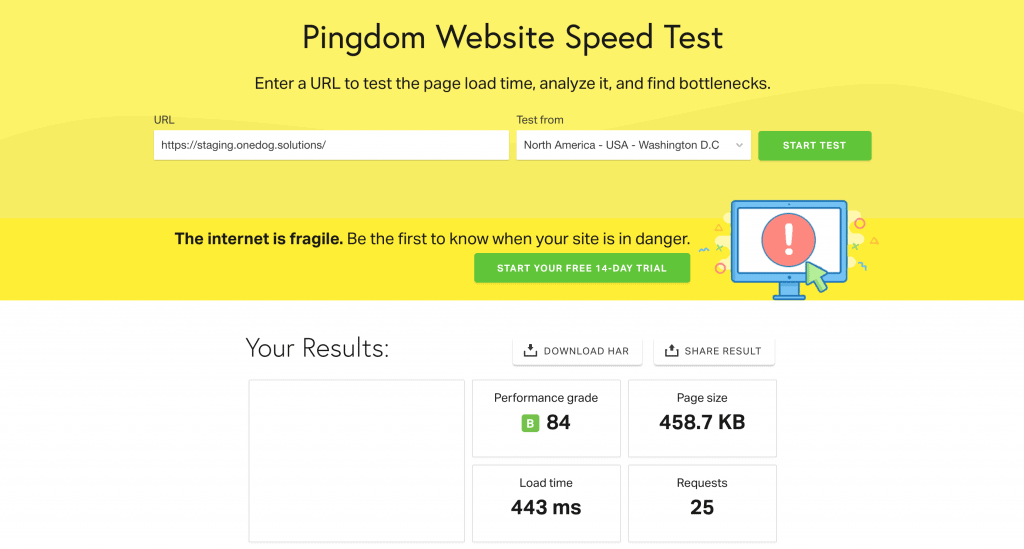
Pingdom Website Speed Test
Pingdom’s speed test is for a single page and is really simple to easily view how quickly your site loads. The report shows a waterfall of what order elements are loading and how long each piece takes to load.
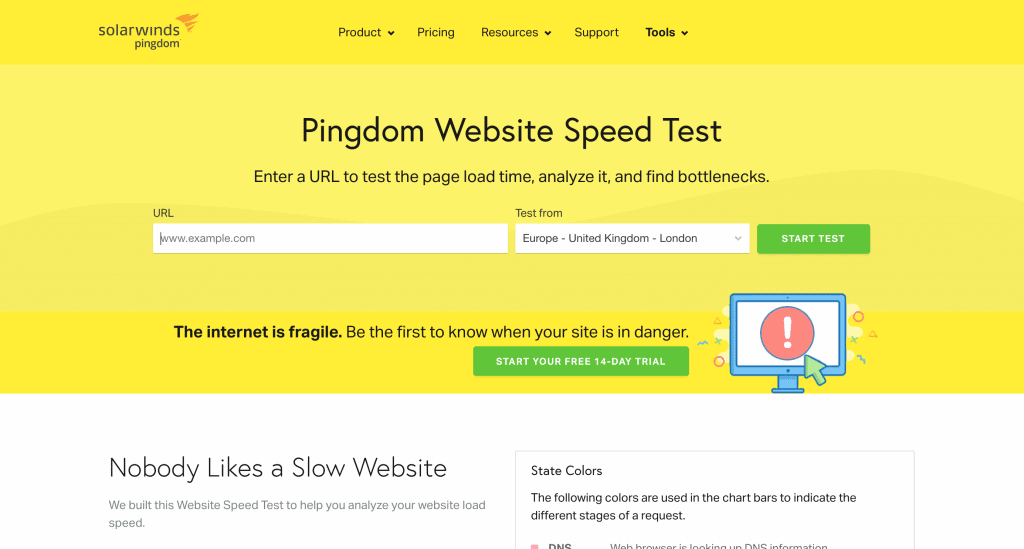
This test measures the desktop speed only, but allows you to test how fast your site is loaded from various locations around the world.
As far as accurate load time for a real user, I’ve found this one to be the closest to how the page loads in real world browsers.
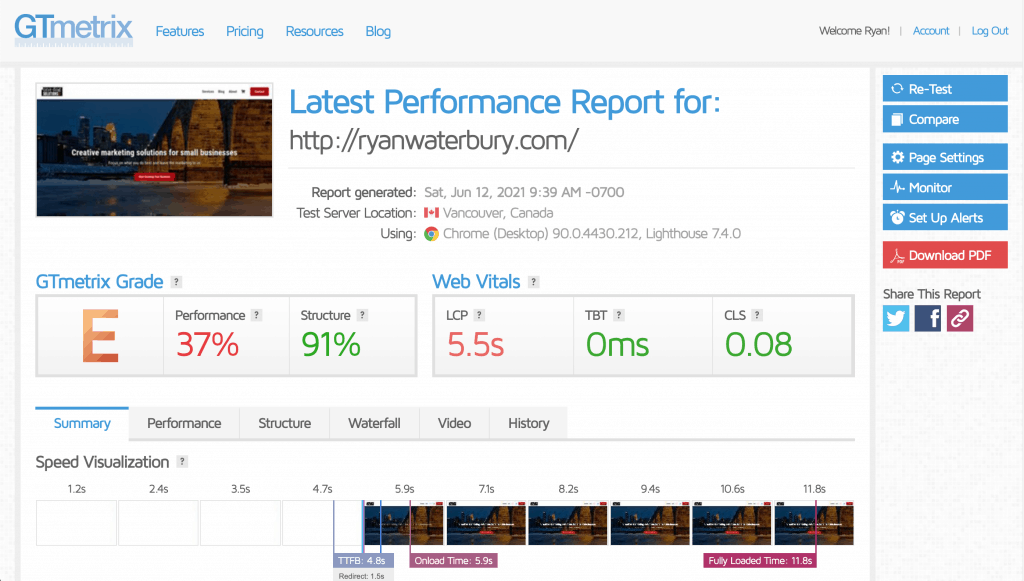
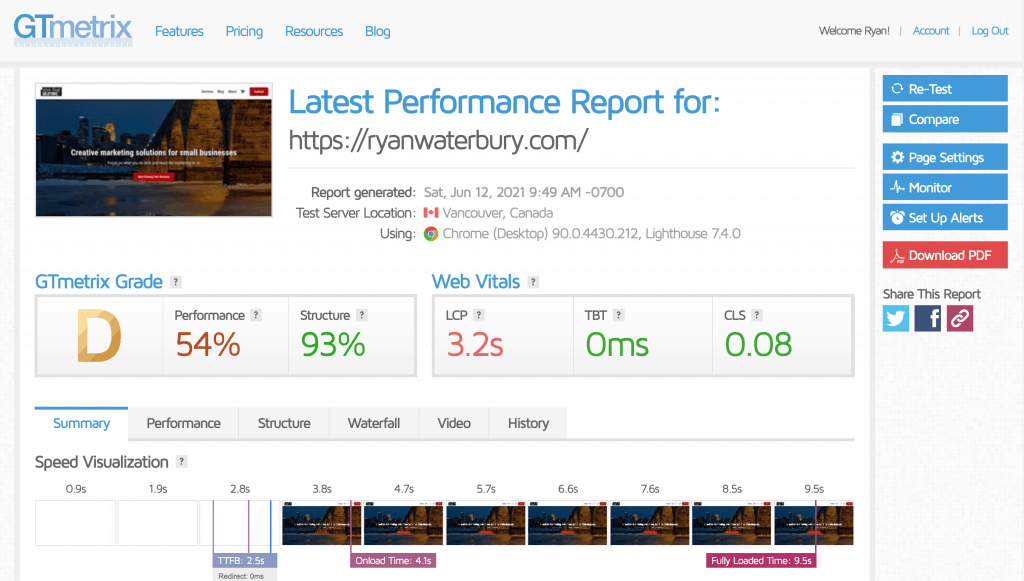
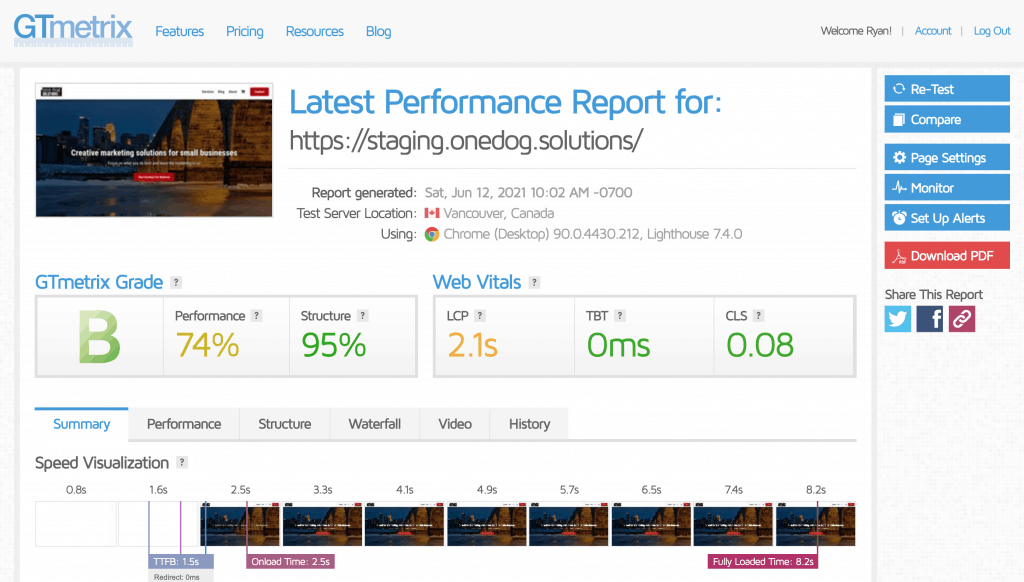
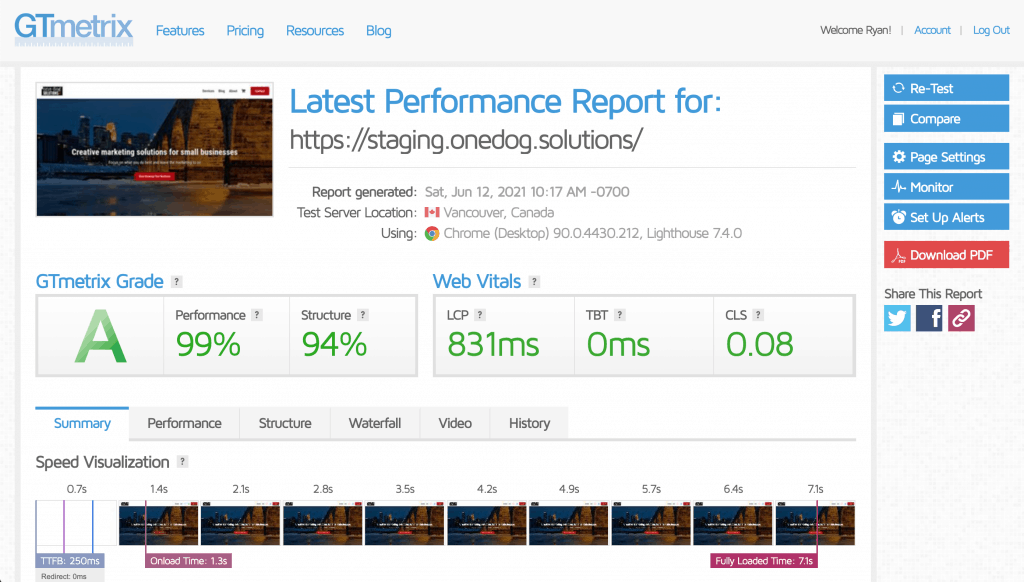
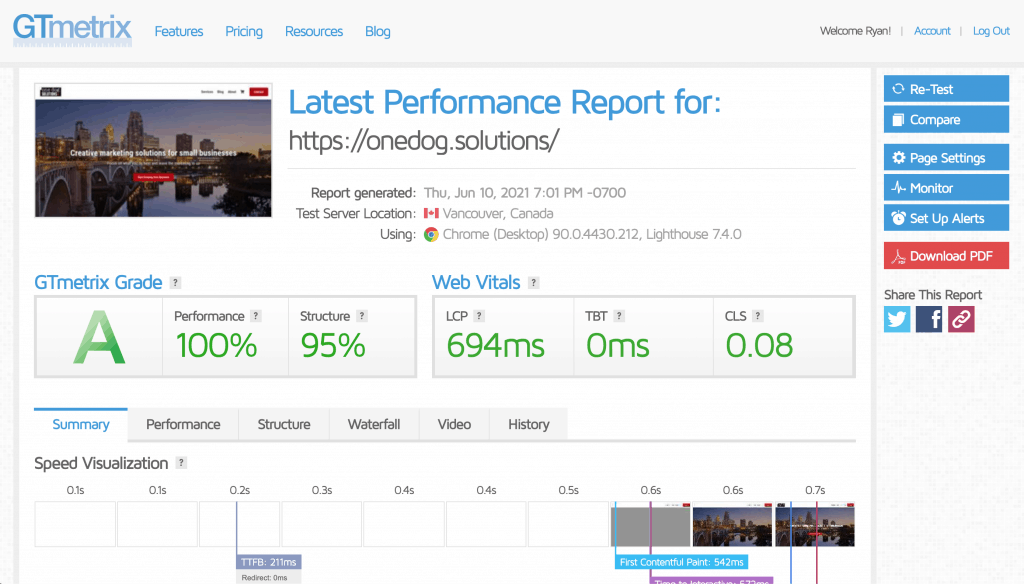
GTMetrix
Our third tool that we use to evaluate website performance is GTMetrix. GTMetrix made a recent change to use Lighthouse data for its measurements. Lighthouse is an open source tool developed by Google, so GTMetrix is now using the same criteria as the Google PageSpeed Insights.
GTMetrix tests the desktop view only on the free version of their service. Creating a free user account does also allow you to change between a handful of location test points as well.
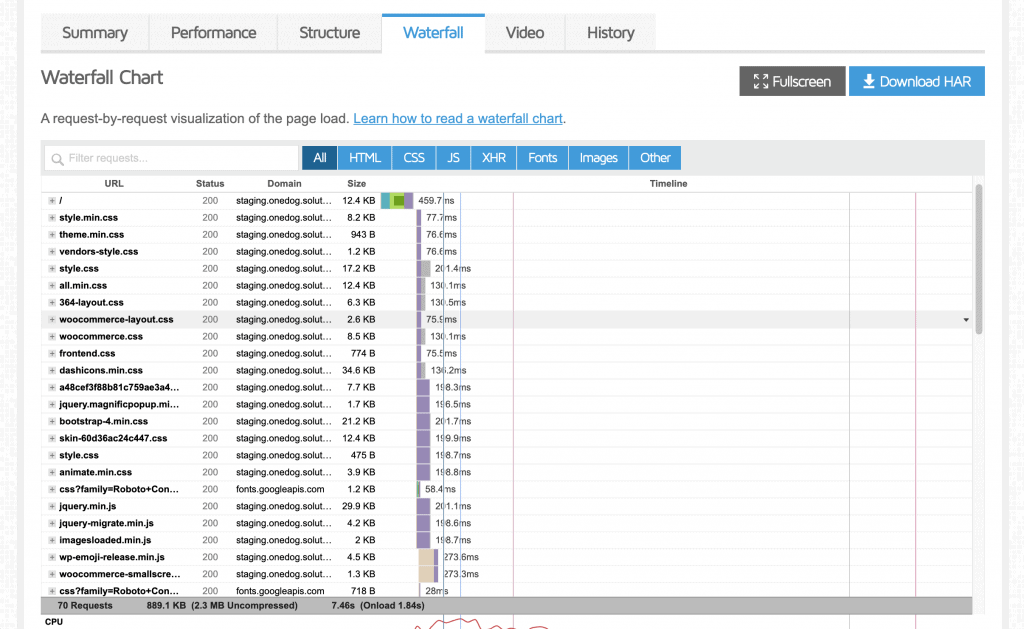
The waterfall report that GTMetrix provides is similar to Pingdom’s and is quite useful. One additional bonus with GTMetrix is the ability to compare two sites against each other.
Our Site Improvement
I’m going to be using our agency site as a model for some improvements. While we were able to make some impressive improvements on page load time at the end of this process, we were already pretty far down the update path with fast hosting, etc.
As a baseline I decided to use an unused domain name for my yet to be published personal project, and start with one of the lesser expensive hosts that advertises the $2.75/month hosting.
We’ll walk through the series of improvements below and briefly explain why and how we made the decisions at each step.
HostGator Baseline Site Test
A quick Google search led us to PC World’s top hosting provider list for 2021. HostGator was the first option, so we started there with a complete copy of our agency site made from an UpdraftPlus backup.
I signed up to the HostGator Hatchling plan that is their lowest plan with shared hosting for one site. This is a pretty basic plan that’s well advertised and is probably the starting point for a lot of DIY sites when a business or charity is just starting out.
Incidentally, during the signup process, I didn’t want to opt into the 3-year hosting plan which would guarantee the $2.75/month. A single month of hosting with HostGator’s basic plan quickly turned into $10.95/month. Other popular hosts like GoDaddy and Bluehost employ similar tactics and usually hit you with the greatly increased rate after year one.
The plan offered a free Let’s Encrypt SSL certificate, and to my surprise some server caching as well. Most of the shared hosting providers do not offer this option. To even this out as a baseline, we performed tests with the HostGator caching on and off.
HostGator No Cache Results
HostGator Cache Results


As we can see there is no big surprise that even with the caching enabled on shared hosting that the site performed poorly. To be fair, we could start optimizing the site to squeeze every ounce of performance out. We would likely see an increase in the Google PageSpeed Insights score (PSI), but the site would still be fairly slow to load.
One Dog Solutions Managed Cloud Hosting
The next set of tests were performed on our managed hosting. We’ve partnered with RunCloud who provides a web based control panel to help us manage a LEMP hosting stack. The managed servers employ aggressive server side caching through NGiNX FastCGI Page Caching as well as Redis Object caching.
The servers we manage are cloud based and provided by either Vultr or UpCloud depending on the region. Vultr has a few more data centers in North America to choose from. With our regional and local clients, we host their sites in a data center closest to their client base or home office.
To keep this a somewhat linear progression of improvements, the first series of tests were performed on the same servers as our live site, but without any caching or optimizations.
RunCloud No Cache Results
RunCloud Cache Results

As you can see there is an immediate improvement in the performance results in almost every test, especially when we employ caching. We’re still seeing some things that can be improved with regard to the PSI results.
Identifying Areas to Improve Your Site Loading
We can look at a few different areas in each report. The waterfall views in GTMetrix and Pingdom can give us some clues as to what we can improve on our pages.
For the PageSpeed Insights we’ll look at the section that lists the areas to improve.
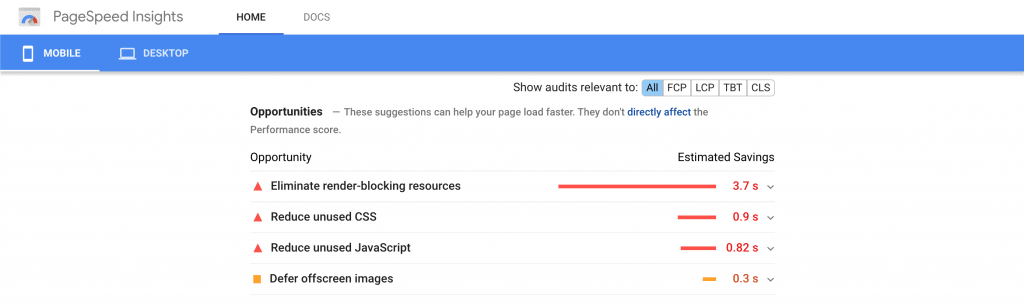
Ironically enough, the biggest item offenders here are . . . from Google.
Analytics and tracking codes are set to load in the head of the page, so these hefty JavaScript tracking codes block the rest of the page from loading.
The other common Google offenders are fonts. Those free web fonts are popular, look nice and ready to use in the block editor and every major page builder.
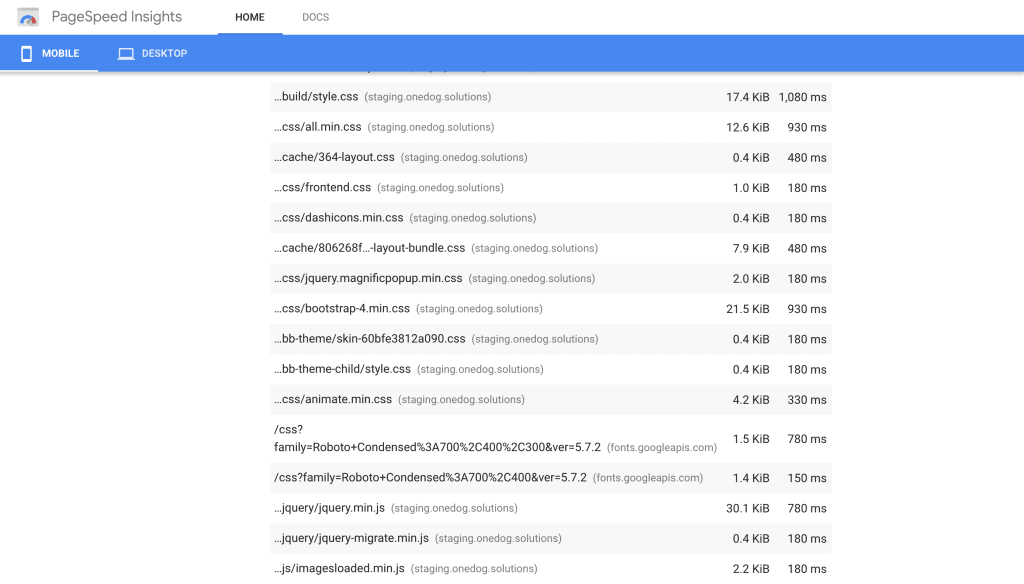
Uncompressed images also add to extra load time. One of the advantages that WordPress does have over other CMS platforms, is that it now lazy loads images. This means that any images that are not called for directly into the viewable area aren’t loaded immediately.
But where do you start with improvements?
How We Improved Our Site Load Time
Our site was loading in under a second, but definitely could be improved. The challenge becomes adjusting elements that you used to build your site and compressing them or arranging how they load – without breaking what you’ve built.
If you’ve noticed in the previous images, we didn’t do these changes on our live site. We created a duplicate site on a subdomain to perform testing in order to find the best optimizations without interrupting any visitors to our main site.
Caching Plugins
Performance plugins can give your site a huge boost. Unfortunately in our scenario, we’re already employing server side caching for full page and object caching through Redis.
This knocked some of the popular caching plugins out of contention for us that include: WP Rocket, W3 Total Cache, or Breeze. These plugins can make a world of difference if you aren’t employing server caching and offer some other optimization options.
It’s the other optimization options that brought us to Fast Velocity Minify (FVM). FVM offers exactly what we need in a companion tool to server side caching.
- Minification of CSS Files
- Removal of unnecessary CSS Files
- Minification of JavaScript Files
- Deferring JavaScript Files
- Delaying of Render Blocking JavaScript Files until user interaction
Enabling the minification options, and delaying Google Analytics tracking until a user interacted with our page were the main wins here. I will caution anyone reading this article, that minification, and CSS or JavaScript combining can break your site. Proceed with caution when using these techniques.
Image Compression
Smaller images can make a huge difference. I’ve used TinyPNG in the past and other applets to compress images as small as possible before uploading, but found that quality is often lost. If you have user submitted content, then asking them to compress images before upload is almost impossible.
We’ve been using ShortPixel on our site, and all the sites we host for clients. Every image uploaded is automatically compressed with the appropriate settings.
As an added bonus, our SEO clients also have their images compressed, converted and delivered in WebP format. WebP files can be up to 35% smaller than their JPEG and PNG versions. Most browsers support WebP files, and as of version 5.8, WordPress will allow direct upload of WebP files to the media library.
Removing Unused Scripts and CSS
This may require some code snippets on your part to fully optimize your site, so we’ll touch on just one example that does not need code to implement.
WooCommerce is a wonderful ecommerce plugin, and powers a third of the ecommerce stores out there today. It also loads its style sheets and scripts on every page of your website. If you let it.
It’s not the only one either. Form builders are notorious for adding scripts to every page, even if you’ve only used the form builder on your contact page.
Fortunately WooCommerce can be reigned in pretty easily with a plugin called Disable WooCommerce Bloat. It does exactly what it’s name says it does, and dramatically speeds up the parts of your site that are not involved in selling products or subscriptions.
Font Optimization
Compressing and loading fonts locally isn’t a new concept. It has typically involved manually uploading any of the fonts that you’ve used in your layouts in the proper format, for all weights used, and then referenced directly in your theme style sheet.
We’ve found a better way to accomplish this, especially if you’re not a developer and need to hasten up your site. OMGF is a neat little plugin that makes the process easy.
The other nice part about OMGF, is that once it’s discovered your fonts, it can preload them so that they are available for use more quickly. Preloading fonts can help reduce Cumulative Layout Shift by making the proper fonts viewable as soon as the page loads.
Preloading Images
One of the biggest culprits in a bad score for Largest Contentful Paint is usually the images in the Hero section. This was the case on our site.
Unfortunately, the few plugins out there do not work well with row background images and page builders. Beaver Builder in particular allows the conditional loading of images based on viewport size, i.e. different images for desktop and mobile. There looks to be some functionality that may allow code additions to background rows in version 2.5 of the Beaver Builder Plugin.
For now, the plus side for us is that we’re using WordPress, and we can add a little snippet to help all of our pages load a little quicker.
//Preload Featured Image
add_action( 'wp_head', function(){
$featured_img_url = get_the_post_thumbnail_url(get_the_ID(),'full');
echo '<link rel="preload" as="image" href="'.$featured_img_url.'"/>';
});
The preceding snippet can be added to your functions.php file of your theme, or with the Code Snippets plugin. This bit of code preloads the featured image for pages and posts, so that they are available immediately, thus reducing the LCP of all pages that we’ve defined a Featured Image for.
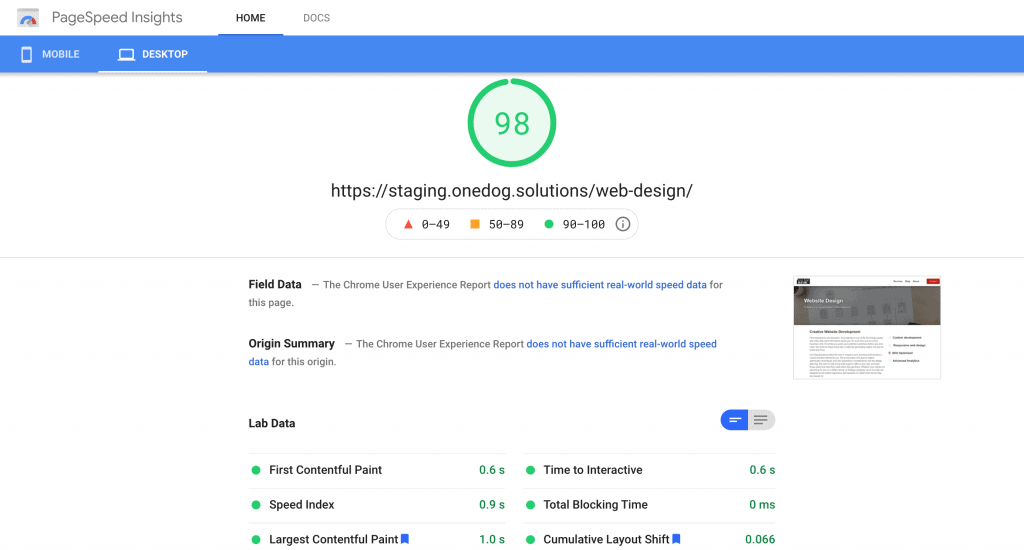
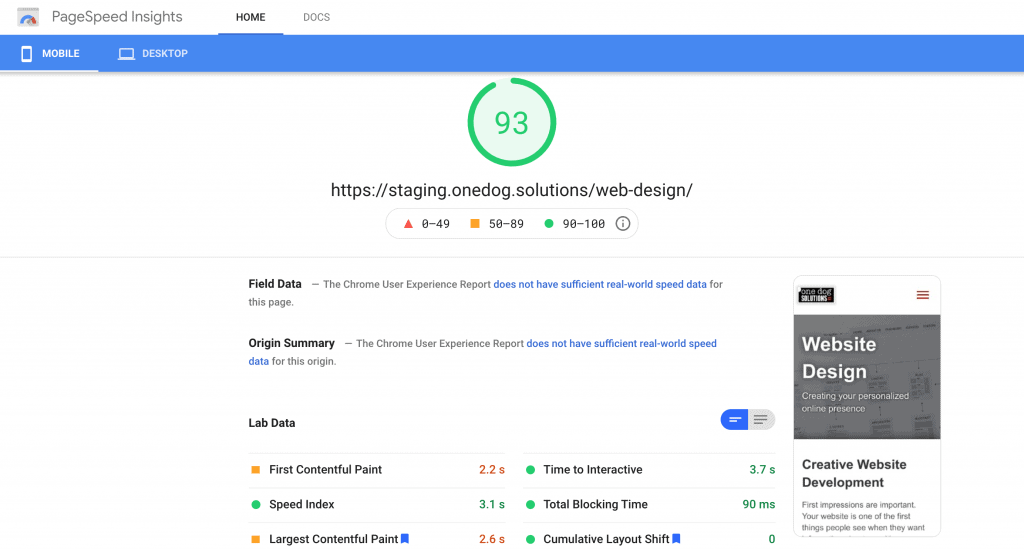
Final Optimized Results
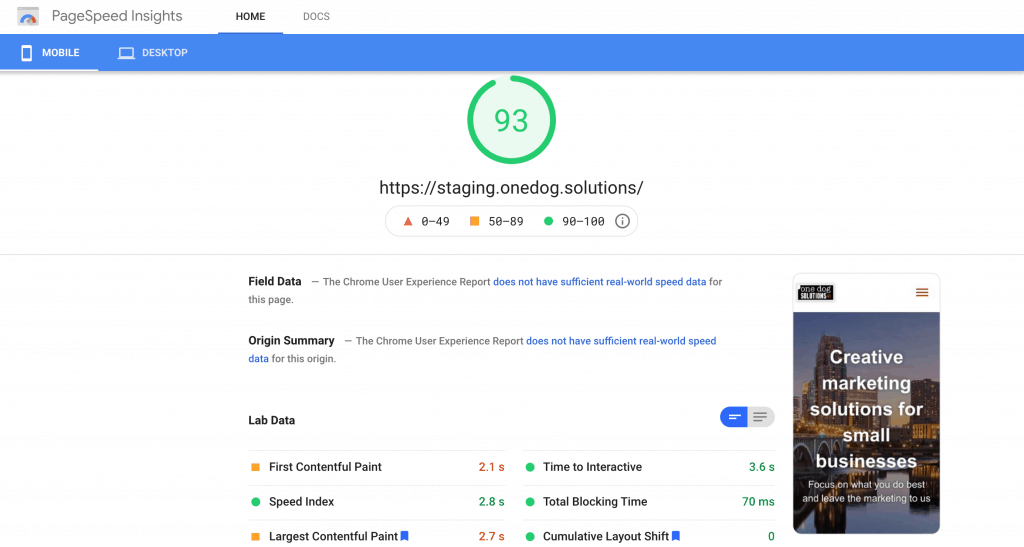
Wrapping Up
Optimizing your site can be a time-consuming task, but well worth it for both SEO and the visitors to your site. We focused on site wide performance tips so that anyone going through this process even casually can see some benefits as you can see below with one of our service pages.
If you have any questions on optimizing your site, feel free to reach out to us at info@onedog.solutions. If you have a tip or comments on how you’ve been able to achieve better results let us know in the comments below!

Learn how to make your next website project a winner!
Download our free guide to learn the secrets to a successful website project, featuring tips that you can implement right away.
"*" indicates required fields
